--This article was originally published on the Marketing Score Blog. We decided to share it here as well because we think you'll find great value in it. Let us know what you think in the comments!
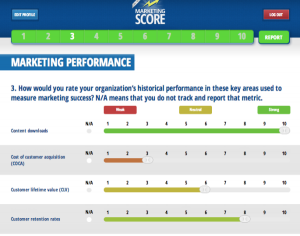
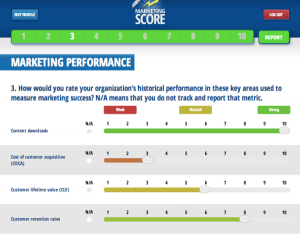
 Section 3 of the Marketing Score assessment focuses on marketing performance. At the end of the day, how does your marketing impact the organization? Marketing Score examines 18 factors, which, to varying degrees, affect your organization’s bottom line.
Metrics such as cost of customer acquisition (COCA), customer lifetime value (CLV), retention rates, lead volume and revenue growth are almost universally accepted key performance indicators (KPIs) for every organization. Supporting metrics, including content downloads, inbound links, social media reach and “owned” subscribers, are critical to showing progress at the top and middle of marketing funnels.
Use Marketing Score to benchmark your organization’s marketing performance, and then construct an action plan that will drive improved results.
Rank Your Marketing Performance
In this post, we run through an overview of each factor featured in the performance section of the assessment.
Traditional Marketing Metrics
Following are more traditional metrics that show the value of your organization’s marketing efforts.
-
Content Downloads: What are your organization’s top downloads? (You’re using content to gather online lead insights and contact information, right?) Consider dynamic apps, videos, webinars, articles, handbooks, or any resources hosted online. Rank this factor well if you’re happy with the quantity and quality of current downloads.
If you don’t have downloadable content on your website, mark “N/A” for this factor, and consider the contact information you could start gathering by placing some of your most valuable content online behind a lead form.
Learn more about content marketing in the Marketing Score Resource Center.
-
Inbound Links: The number of quality inbound links coming to your website signal power to search engines like Google or Bing. The Wikipedia entry for backlink has more details.
You can also identify the power of inbound links to your site with tools such as SEOMoz’s mozRank and Open Site Explorer, or HubSpot’s Marketing Grader.
-
Lead Quality Score: How do incoming leads compare to your organization’s ICP (ideal customer profile)? Do you have automated scoring set up to grade incoming leads? If you’re unsure about how to grade leads, here are a few helpful resources:
- Are They Hot or Not? A guide to aligning marketing and sales by implementing lead scoring, from Marketo.
- Lead Scoring: 13 Criteria You Should Be Using to Grade Leads, by HubSpot.
- Big List of Lead Scoring, a checklist with more than 250 lead scoring rules from Marketo.
- What Is Lead Scoring and How Can It Benefit My Business?, from Kentico DevNet.
-
Lead Volume: How does your lead volume rank in terms of the resources put into top-of-funnel (TOFU) marketing? A tip to help assess your organization’s lead volume: work backward. What’s the overall business goal for marketing, and how many marketing qualified leads (MQLs) do you need to achieve that type of conversion?
-
Social Media Engagement: Whether social media drives brand awareness, customer service, media relationships, or retention, are your organization’s social media efforts engaging two-way conversations?
Social Media Today’s article, Measuring Engagement Levels in Social Media, by James Meyer (@NetProfitsMedia), offers a few good tools for finding additional insights into your social media performance.
-
Social Media Reach: Evaluate your social media reach based on what drives community and your brand. Do social media efforts promote your organization as a thought leader and influencer? Is reach growing—with the right audiences?
“Efforts to promote social profiles, pages, sharing, and engagement are meaningless unless they support a path to conversion and positively impact the bottom line.” – Rebecca Murtagh (@virtualmarketer), 5 Steps to Calculate Social Media ROI Using Google Analytics
-
Subscribers (Blog, Email, Newsletter, Etc.): How have your “owned” contact lists grown? Do you have a steady influx of subscribers to your blog or email list, and are you actively engaging your most interested audiences? Note, lists you have bought or rented don’t count. Opt-ins only!
- Website Traffic: Much of what traditional marketing efforts drive is TOFU (top of the funnel) awareness and brand building. Social media efforts, content, blogging, events, speaking and PR aim to bring visitors to your website.
Does your organization measure overall website traffic, and is your website meeting the traffic goals that will convert leads and sales? How do your traditional marketing performance metrics add up? Take Marketing Score to benchmark and improve performance.
Integrated Marketing Metrics
As marketing and sales work more closely together, advanced metrics can track and measure the marketing performance that drives business results. The following metrics tackle marketing’s effect on the bottom line, and require close sales integration.
-
Cost of Customer Acquisition (COCA): To oversimplify, COCA takes your entire cost to acquire a customer over a given time, and divides it by the number of customers you acquire in that given time. Complexities arise when you take into account different variables that may be included in the formula, such as sales, support and marketing staff compensation.
For well-balanced business, COCA should be less than customer lifetime value (CLV, #10 on our list). Most businesses also aim to recover COCA over a set time frame. This advice, and a few example formula templates to find your COCA, can be found within the For Entrepreneurs’ blog post, Startup Killer: the Cost of Customer Acquisition.
-
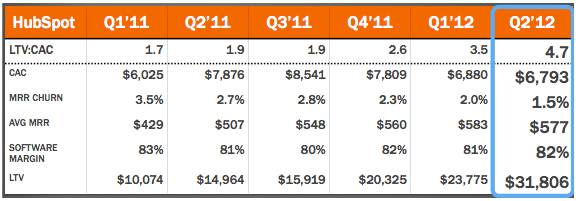
Customer Lifetime Value (CLV): “At its simplest, the formula is meant to compare revenues generated by customers to the costs associated with acquiring them.” – J.J. Colao (@JJColao), Forbes, In Defense of the Lifetime Value (LTV) Formula
To differentiate from No. 9, COCA looks at what resources your organization puts into landing new customers, while CLV examines the potential value that customers bring to your organization.
The article above examines HubSpot’s CLV model, via this equation: [Monthly Recurring Revenue (MRR) xMargin]/Churn = CLV. The screenshot below shows how HubSpot arrives at its totals.
-
Customer Retention Rates (CRR): Customer retention may be a performance measurement that most marketing managers dismiss or lack necessary insights to calculate. However, as marketing capabilities move deeper through the funnel to help improve customer loyalty, marketing, sales and customer service departments must share strategies and results.
How are your organization’s marketing efforts aimed to engage and nurture existing customers, and increase loyalty to start the sales cycle over again? Focus here if your product, service or existing customer base has potential to act as brand ambassadors.
An easy formula to calculate CRR: (Original Number of Customers – Lost Customers) / Original Number of Customers for the Given Period = CRR. For example, if you start the month with 100 customers, and lose 30 of the original customer base, the formula would be: (100-30)/100=70% CRR. Note: Do not include any new sales from this period of time.
-
Employee Retention Rates: Employee retention implies that your marketing team focuses on internal audiences, as well as boosts overall company perception. Good retention rates vary by industry, but impact the bottom line across the board in terms of the internal resources needed to interview, hire, onboard and develop new employees.
To find your company’s retention rate, look at number of employees last year at this time. For example, let’s say company ABC had 500 employees. After a full year, 350 of those original 500 employees are still working at company ABC. The retention rate is 350 / 500, or 70% (which isn’t very good).
-
Inbound Job Candidates: Job candidates may not be the most obvious performance metric, but companies that have the business cores and marketing foundations in place can tap into a larger, higher-quality pool of talent.
The more brand awareness your company generates, the easier it will be to hire. Rather than seeking out the best applicants, a powerful marketing program can prompt highly qualified candidates to find and engage your company for career opportunities.
-
Lead-to-Sale Conversion Rates: Once your marketing program starts to bring in leads, you have an opportunity to convert them to customers. Make sure your leads are well qualified by assessing the lead-to-sale conversion rate. You can measure it with the following formula: (Total Lead Conversions / Total Leads) x 100.
There are a lot of articles out there about improving lead conversion rates. Here are a few:
- 30 Lead Conversion Strategies, by Marketing Wizdom.
- 10 Ways to Improve Your Website Conversion Rates, by Added Bytes.
- The Technology You Need to Fix Dismal Lead-to-Customer Conversion Rates, by HubSpot.
-
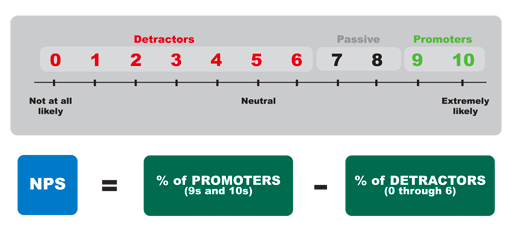
Net Promoter Score (NPS): Net Promoter Score is based on the theory that one question, “How likely is it that you would recommend Company ABC to a friend or colleague?” can measure customer perception and performance.
Here’s an example NPS scale:
-
Profitability: In The Marketing Agency Blueprint, Paul Roetzer (@paulroetzer) declares that, “inefficiency is the enemy of success.” He goes on to show that the more efficient marketing practices are, the more profitable businesses can become.
Any marketing metric you can tie to the bottom line gives marketers the chance to prove impact on profit. Consider some of the following when ranking marketing’s impact on profitability:
- How well is your marketing team talent bringing solutions to the table and getting high-quality work done?
- Is every marketing program tied to a bottom line business goal?
- How is marketing driving COCA down?
- How are you marketing to your most loyal customers for a more profitable upsell, referral and greater CLV?
-
Referrals: Often one of the strongest assets an organization can have—referrals are the direct result of a positive experience with your company, and bottom of the marketing funnel result of continually engaging existing customers.
Is your marketing team working to engage existing customers, making the most of customer testimonials, and tracking customer referral results?
-
Revenue Growth: “The sole purpose of marketing is to sell more to more people, more often, and at higher prices. There is no other reason to do it.” – Sergio Zyman, The End of Marketing As We Know It
You really can’t be more clear than this. Is your marketing program designed to sell, and is it working well to drive revenue? Rate your marketing accordingly.
Improve Marketing Performance
Growing your marketing team, program and results starts with the benchmark of where you are now. As you rate your marketing performance, consider strengths and challenges throughout the factors above. It’s a great conversation starter within the marketing department, between marketing and sales departments, and among an organization’s leadership team that proves marketing performance impacts bottom line results.
Let us know how you’ve been measuring marketing performance: what factors are the most important to your team, and what more are you measuring that may not be included above?

%20Logo_BlueOrange_Trademark.png?width=800&height=269&name=Ready%20North%20(RN)%20Logo_BlueOrange_Trademark.png)


.jpg?width=300&name=Services%20Hub%203%20(3).jpg)


COMMENTS