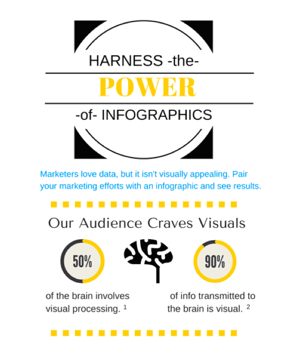
 Marketers love data, and with good reason. We’re able to back our recommendations and research with data-driven reasoning, proving our credibility.
But, let’s face it: Data in isolation isn’t visually appealing.
Who wants to read a spreadsheet full of numbers, or a blog post that lists one statistic after another before getting to the heart of the issue? How can we make data-fueled recommendations, all the while pleasing the eye and appealing to those of us who aren’t number savvy?
Enter infographics.
An infographic defined is a data-rich visualization of a story or a thesis used to educate, inform, build brand awareness and create inbounds links.
Read on to learn how and why infographics can add value to your marketing efforts.
Give Your Audience What They Want
It’s simple psychology that our audience craves visuals.
Ninety percent of information transmitted to the brain is visual, while 65% of the population identify as visual learners. Naturally, our marketing efforts should satisfy that thirst for graphical content.
Infographics are also more eye-catching than the plain, written words in our email inboxes, text messages and RSS feeds. We’re suffering from information overload, and on average, we only read 28% of written words we see. Infographics help counteract information strain, thanks to its engaging, memorable nature.
Psychology Today reported that visual cues also help us retrieve and remember information. Clearly, infographics are a much-needed vacation for our overworked temporal lobes.
Create Shareable Visuals More Likely to Go Viral
So you’ve created content, but it isn’t leaving your site? Oftentimes, more visual content is the answer.
In fact, according to Piktochart, social media users are 40% more likely to share infographics than non-visual content. Why? Infographics are easy to share on photo-friendly platforms, including Facebook, Twitter, Pinterest and Instagram.
And, the big benefit, infographics have higher potential to go viral.
In a study by the BuzzSumo team, infographics were more likely to go viral than any other type of content created, including lists, blog posts or videos. To get there, see how others found viral success with a consistent method, unique story and trusted data.
Tip: House infographics on your website or blog, add keywords to the title of the page and embed inbound links to draw in traffic—and have that traffic stick around.
Repurpose What You’ve Created
Picture this: you’ve created an awesome blog post or premium content piece, drove decent traffic, and now, it’s stalled. No new leads, comments or views, but you want to keep the momentum building.
Infographics serve as a quick, inventive way to repurpose evergreen content. And, they may do a better job of creating something interesting and useful for your audience. With a visual, you have potential to reach a new audience that may be interested in the original content, but not interested in reading text.
Not a Designer? Not a Problem
Now, you’re sold on the power of infographics, but a new problem arises. You’re not a designer.
Good news: It’s okay, because we’ve compiled a list of resources for the Regular Joes to design like the pros.
- 10 Free Infographic Templates (HubSpot)
- Simple, free graphic design software (Canva)
- Create easy infographics, reports and presentations (Piktochart)
- Free infographic maker (Venngage)
- Create and share visual ideas online (easelly)

Download a PDF version of the infographic, or use the embed code below to share on your website.
Share this Image On Your Site
What successes have you found with infographics? Comment below and share your experiences.

%20Logo_BlueOrange_Trademark.png?width=800&height=269&name=Ready%20North%20(RN)%20Logo_BlueOrange_Trademark.png)


.jpg?width=300&name=Services%20Hub%203%20(3).jpg)

